
Increasing logistics efficiency by 15% doesn’t require new technology or staff; it demands a shift in perspective.
- The greatest gains are found by systematically eliminating the ‘invisible’ process waste and breaking down the data silos that already exist in your network.
- Applying proven Lean principles like Gemba walks reveals these costly inefficiencies, allowing for targeted, high-ROI improvements using your current resources.
Recommendation: To begin, conduct a focused “Waste Walk” to map one of your core processes as it truly operates, not just as it’s documented.
For any logistics director, the pressure is constant: reduce transit times, lower cost-per-shipment, and increase throughput. Yet, these demands often arrive alongside a budget freeze and a hiring stop. The conventional playbook offers familiar, capital-intensive solutions—invest in a new TMS, build another distribution center, or hire more analysts. While these can be effective, they are slow, expensive, and sidestep the fundamental question: is your current network operating at its true potential?
But what if the key to a 15% efficiency gain isn’t in adding resources, but in radically optimizing the ones you already possess? The answer lies not on a purchase order, but on your own warehouse floors, in your transport lanes, and within your existing data streams, often hidden in plain sight. This is the core principle of Lean management: unlocking significant performance improvements by systematically identifying and eradicating waste.
This article provides a data-driven framework for logistics leaders to uncover that hidden potential. We will move beyond surface-level metrics to explore how to identify deep-seated operational waste, apply Lean principles to complex global flows, make smarter hub decisions based on real data, and build a network defined by resilience—all without increasing your headcount.
This guide offers a structured approach to network optimization, moving from foundational waste identification to advanced strategic realignment. The following sections break down the critical components for achieving sustainable efficiency gains.
Summary: A Lean Framework for Network Efficiency
- Why does your current network map hide 30% of actual operational waste?
- How to apply Lean principles to cross-border logistics processes without disrupting flow?
- Centralized vs Decentralized hubs: Which model cuts transit times for regional markets?
- The data silo error that delays critical logistics decisions by 48 hours
- When to expand network capacity: 3 distinct signals before the bottleneck hits
- How to calculate the true impact of a costly delay beyond just the shipping fee?
- How to realign strategic management of global supply chains for resilience over cost?
- How to maintain reliable transportation continuity during global carrier bankruptcies?
Why does your current network map hide 30% of actual operational waste?
Your network diagrams and process flowcharts represent an ideal state, but they often mask the reality of daily operations. The gap between the documented process and the actual workflow is where significant waste accumulates. This is not a minor discrepancy; a staggering lack of visibility is the industry norm. According to one report, nearly half of logistics professionals are in the dark for over 50% of their shipments, and only 24% have visibility on most of their shipments. This “visibility gap” isn’t just about tracking dots on a map; it’s about not seeing the process deviations, bottlenecks, and workarounds that consume time and resources.
To uncover this hidden waste, you must go to the “Gemba”—the actual place where work happens. This fundamental Lean principle involves direct observation of processes on the warehouse floor, at the loading dock, or within the customs clearance office. It replaces reliance on static reports with first-hand knowledge of operational friction. By observing the flow of goods and information directly, you can identify the eight types of waste (Muda): defects, overproduction, waiting, non-utilized talent, transportation, inventory, motion, and extra-processing.
Case Study: GT Logistics’ Gemba Walk Implementation
GT Logistics faced challenges with paper-based field tours, leading to data traceability issues and wasted time during audits. By implementing digitalized Gemba Walks, they moved from an overloaded, reactive system to a proactive one. This allowed them to document observations directly from the field, leading to significant optimization of production processes, improved quality, and a marked reduction in operational waste. Their success demonstrates that the simple act of structured observation, enhanced by modern tools, can unlock major efficiency gains.
Implementing a structured approach to these observations is critical for turning insights into action. A “Waste Walk” is not a casual stroll; it is a systematic diagnostic tool designed to pinpoint specific areas for improvement without disrupting ongoing operations.
Action Plan: Your Network Waste Walk Methodology
- Define Objectives: Before each walk, establish a clear objective. Are you focusing on dock-to-stock time, order picking accuracy, or truck loading procedures? A focused goal prevents the exercise from becoming overwhelming.
- Prepare Documentation Tools: Use digital tools like a tablet or smartphone to document observations. Take notes, photos, and even short videos of dysfunctions, waste, and employee feedback to facilitate later analysis.
- Observe Physical Flow: Visit the warehouse to observe congested areas, unbalanced stock levels, and excessive movement. These are physical symptoms of underlying process flaws that can be adjusted to streamline logistics.
- Identify Bottlenecks: On the production or packing line, identify the steps that are slowing down the entire process. A bottleneck is a high-leverage target for immediate corrective measures that can eliminate waste across the system.
- Schedule and Track: Make Gemba visits a recurring routine, not a one-time event. Schedule them regularly, track the progress of implemented changes, and adjust your approach to embed a culture of continuous improvement.
How to apply Lean principles to cross-border logistics processes without disrupting flow?
Cross-border logistics introduces layers of complexity—customs, tariffs, carrier handoffs, and documentation—that are ripe for generating waste, particularly waiting and over-processing. Applying Lean principles here is not about cutting corners but about creating a smooth, continuous flow of goods and information. The goal is to design a process so robust and transparent that it minimizes the potential for delays and errors before they occur. This requires shifting from a series of disconnected, sequential steps to an integrated system viewed as a single value stream.
A key to this is Value Stream Mapping (VSM), a Lean tool used to visualize the end-to-end process. By mapping every step, from placing an order to final delivery, you can identify non-value-added activities—the parts of the process that consume resources but do not add value for the customer. In a cross-border context, this could be waiting for a customs broker, redundant data entry into multiple systems, or physically moving cargo to a secondary inspection area.
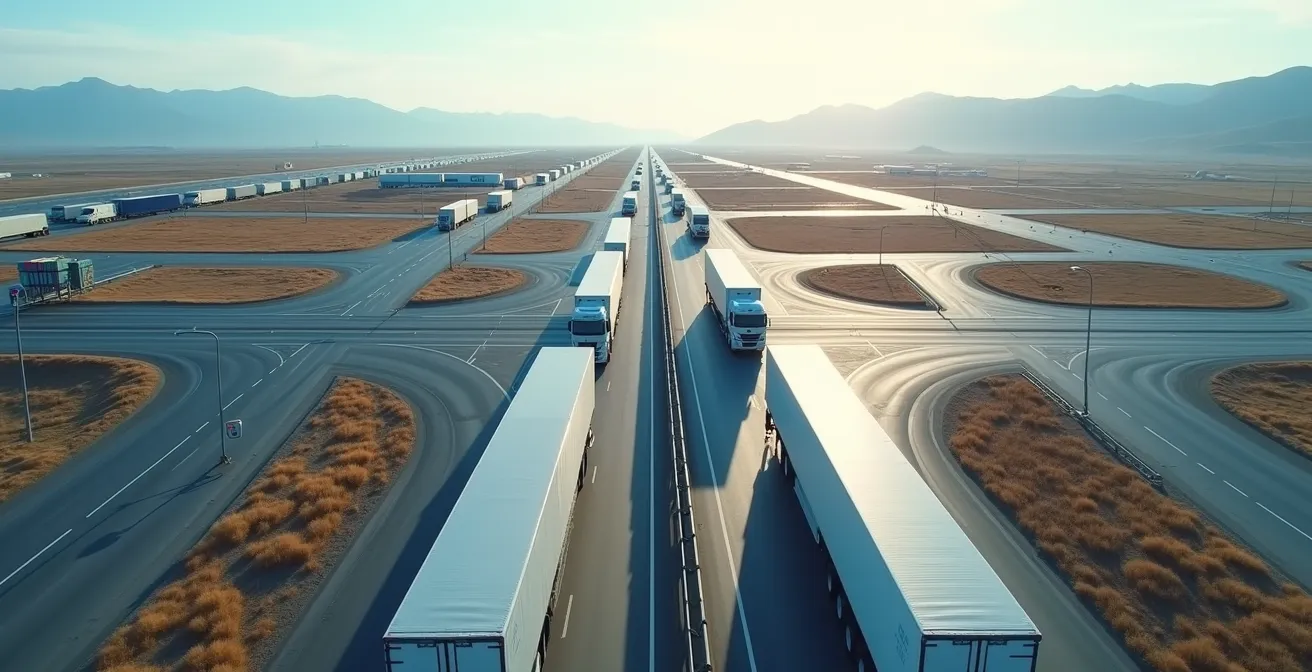
As the image above illustrates, the ideal state is one of organized, predictable movement. Achieving this flow involves a fundamental change in how problems are identified and solved. Instead of relying on top-down directives issued after a delay has already occurred, a Lean approach empowers employees on the ground—the ones closest to the work—to provide insights and participate in solutions.
The distinction between a traditional, reactive approach and a proactive, Lean-optimized one is stark. The latter focuses on systemic improvements that prevent disruptions, rather than just managing them. A comparative analysis highlights the operational advantages.
| Process Element | Traditional Approach | Lean-Optimized Approach |
|---|---|---|
| Documentation Flow | Sequential validation with multiple handoffs | Direct observation and first-hand understanding of problems through a Gemba approach. |
| Waste Identification | Reactive problem-solving after delays occur | Focus on eliminating the 8 types of waste (Muda) through direct shop floor observation. |
| Problem Resolution | Top-down directives from management | Employee involvement, with workers providing insights as they are closest to the work. |
| Communication | Formal reports and meetings | Direct interaction between management and operators, improving communication and boosting morale. |
Centralized vs Decentralized hubs: Which model cuts transit times for regional markets?
The structure of your physical network—the location and function of your distribution centers (DCs) and hubs—is a primary driver of both cost and service levels. The classic debate pits a centralized model (fewer, larger DCs serving wide regions) against a decentralized model (more, smaller hubs closer to end customers). There is no single correct answer; the optimal choice depends entirely on your product, customer expectations, and regional market density. A centralized model offers economies of scale and simplified inventory management but can lead to longer transit times and higher last-mile costs. A decentralized model provides faster delivery and greater market responsiveness but increases overhead and inventory complexity.
To make a data-driven decision, you must analyze the trade-offs. The key is to model the total landed cost, including inventory holding costs, not just transportation. For high-demand products with predictable sales, a hybrid “hub-and-spoke” model often works best, using central hubs to feed regional spokes. For e-commerce businesses competing on delivery speed, a more decentralized network of fulfillment centers is almost a necessity. The rise of direct-to-consumer (DTC) brands like Warby Parker and Casper, who utilize direct shipping from strategically placed locations, highlights the power of decentralization when speed is paramount.
This network design is not a one-time decision. It must be continuously evaluated as market conditions, fuel costs, and customer demands evolve. The potential gains from optimizing this structure are immense. For example, analysis from McKinsey shows that the right data-driven approach to supply chain management can lead to dramatic results. One study indicated that integrating AI into network decisions could reduce inventory by 35% and lower costs by 15%, leading to a potential 65% improvement in overall efficiency. While AI is a tool, the underlying principle is using data to make smarter structural choices.
Ultimately, the decision to centralize or decentralize should be guided by a clear understanding of your service goals. If your competitive advantage is next-day delivery in major urban centers, a decentralized model is superior. If your customers prioritize cost over speed for bulk industrial goods, a centralized model is likely more efficient. The key is to let data, not assumptions, guide your network’s evolution.
The data silo error that delays critical logistics decisions by 48 hours
In modern logistics, data is as critical as physical cargo. Yet, this data often exists in isolated pockets—a “data silo”—within the transportation management system (TMS), the warehouse management system (WMS), the finance department’s ERP, and the carrier’s own tracking portal. This fragmentation creates decision-making blindspots. When a disruption occurs, like a port delay or a customs hold, the information needed to react effectively is scattered. It takes hours, or even days, of manual effort to piece together a complete picture, by which time the window for an optimal response has closed. This 48-hour lag is the direct cost of data silos.
Breaking down these silos is not primarily a technology problem; it is a process and integration challenge. It involves creating a “single source of truth” where data from across the supply chain is accessible in real-time. This allows for proactive management rather than reactive firefighting. For instance, integrating carrier performance data with warehouse outbound schedules can help you dynamically reassign loads to more reliable carriers before a failure occurs, rather than after.

The goal is to create a seamless flow of information that mirrors the desired physical flow of goods. As this image of light through fiber optics suggests, data should travel without friction. The ROI on achieving this is significant. By automating the handoffs between systems and reducing the manual interventions that introduce errors, companies can unlock substantial savings. According to McKinsey, automation can reduce logistics operating costs by 15%, largely by improving data flow and consistency.
To start breaking down these silos without a massive IT overhaul, focus on three key areas. First, establish cross-departmental KPIs that force different teams (e.g., warehousing, transportation, procurement) to look at the same metrics. Second, implement real-time performance tracking for key partners like carriers, and share this data transparently to drive accountability. Finally, foster a culture of continuous improvement where employees are encouraged to identify data gaps and suggest solutions. This shifts the organization’s mindset from protecting departmental data to sharing it for the collective good.
When to expand network capacity: 3 distinct signals before the bottleneck hits
Expanding network capacity—whether by adding warehouse space, leasing more trucks, or opening a new hub—is one of the most significant capital decisions a logistics director can make. Acting too late creates a debilitating bottleneck that damages customer relationships and inflates costs. Acting too early ties up capital in underutilized assets. The key is to identify the leading indicators that signal an impending capacity crunch, allowing you to act proactively but with precision.
The first signal comes from your own operations. Are you consistently relying on overtime to meet daily quotas? Are you using temporary or overflow storage space more than 20% of the time? These are clear signs that your existing infrastructure is stretched to its limit. Direct observation through Gemba walks can provide powerful evidence here. For example, one company that implemented regular Gemba walks saw a 22% increase in production efficiency and an 18% decrease in defect rates, demonstrating that you can often create more capacity within your existing footprint before expanding.
The second set of signals is external, coming from broader economic trends and market indicators. You must monitor these to anticipate shifts in demand before they hit your network. The third signal is purely financial, related to your cost structure. When your overhead costs as a percentage of revenue begin to climb consistently, it can indicate that your network is becoming inefficient at its current scale.
Tracking these signals in a structured way provides a clear, data-backed rationale for when to invest in expansion. The following table outlines key indicators and their corresponding action thresholds.
| Signal Type | Indicator | Action Threshold |
|---|---|---|
| Manufacturing Output | Modest improvements following months of contraction | Sustained growth over 2-3 consecutive months |
| Port Congestion | Eased congestion as carriers adapt to agile routing | Return to pre-2023 congestion levels, signaling higher volumes |
| Inventory Normalization | Inventory gluts on trend to normalize, releasing pent-up demand | Inventory-to-sales ratio falls below the historical average |
| Cost Structure | Gross margins of 20%-40%, with overhead consuming 83%-86% of revenue | Overhead as a percentage of revenue consistently exceeding 86% |
How to calculate the true impact of a costly delay beyond just the shipping fee?
When a shipment is delayed, the most visible cost is the freight charge itself, or perhaps a penalty fee for a missed delivery window. However, this figure represents only the tip of the iceberg. The True Cost of Delay (TCOD) is a far larger, more complex calculation that captures the cascading financial impacts across the entire organization. Failing to measure this true cost leads to a dangerous underestimation of the value of network reliability.
The first layer of hidden costs is related to inventory. A delayed inbound component can shut down a production line, resulting in lost production value and idle labor costs. A delayed outbound product means that capital remains tied up in finished goods sitting in a warehouse, incurring holding costs. It may also trigger the need for expensive expedited freight to meet a customer deadline, a cost that can be many times the original shipping fee. The last-mile delivery segment is particularly prone to these hidden costs; one analysis found that AI-driven optimization can help tackle the 53% of shipping costs eaten up by last-mile delivery alone through better pattern recognition.
The second layer of costs is operational. A delay creates a surge of administrative work. Customer service teams are inundated with calls, requiring staff to spend time tracking shipments and managing frustrated customers instead of on value-adding activities. Logistics planners must scramble to find alternative routes or carriers, often at a premium. The wear and tear on assets can also increase if inefficient backhauling or rerouting is required to compensate for a delay.
The final, and often largest, cost is commercial. Chronic delays damage your brand’s reputation for reliability. This can lead to penalty clauses being invoked in contracts, reduced future orders, and ultimately, customer churn. To calculate the TCOD, you must track these components systematically:
- Inventory Impact: Calculate the cost of holding safety stock and the financial impact of stockouts or production stoppages.
- Operational Impact: Measure the increase in customer service escalations and the premium paid for expedited freight or spot-market capacity.
- Commercial Impact: Quantify any contractual penalties and, if possible, model the long-term revenue loss associated with a decline in customer satisfaction scores.
How to realign strategic management of global supply chains for resilience over cost?
For decades, the primary goal of supply chain management was cost reduction, often achieved through single-sourcing from low-cost regions and operating with minimal inventory. The disruptions of recent years have exposed the fragility of this model. The new strategic imperative is resilience—the ability of a supply chain to withstand and recover from shocks. This represents a fundamental shift in mindset, moving from a narrow focus on minimizing immediate costs to a broader focus on ensuring long-term continuity and stability.
This shift from cost to resilience is not just a theoretical concept; it’s a strategic necessity recognized by industry leaders. As one analysis notes, the focus has changed dramatically in today’s volatile environment.
It is no longer simply about reducing costs; rather creating robust systems capable of adjusting real-time variables in today’s volatile environment.
– Industry Analysis Report, Logistics and Supply Chain Trends in 2024
Building a resilient network involves several key actions. First is supplier diversification, moving away from reliance on a single supplier or geographic region. This may mean slightly higher unit costs in the short term, but it provides a critical buffer against localized disruptions. Second is building network redundancy, such as having alternative ports, carriers, and transportation modes pre-qualified and ready to activate. Third is investing in visibility and predictive analytics to anticipate disruptions before they occur. Even entire nations are now focused on this; for example, recent logistics efficiency improvements in China aim to create a more robust and cost-effective national infrastructure.
This does not mean that cost becomes irrelevant. Rather, it is about making smarter trade-offs. The “cost” of a resilience-building initiative, like qualifying a second supplier, should be weighed against the potential “True Cost of Delay” that it helps to mitigate. A resilient supply chain is ultimately a more cost-effective one over the long term, as it avoids the massive financial and reputational damage that comes from a major network failure.
Key Takeaways
- Gemba walks are the most effective tool for uncovering the ‘invisible’ waste that exists between your documented processes and operational reality.
- True data integration is not about buying new technology; it’s about breaking down the organizational silos that prevent timely, informed decision-making.
- Network resilience, while sometimes requiring upfront investment, is a far more valuable long-term performance metric than immediate, short-sighted cost reduction.
How to maintain reliable transportation continuity during global carrier bankruptcies?
A global carrier bankruptcy is one of the most severe shocks a logistics network can face. It can strand cargo, sever key transport links, and throw carefully planned schedules into chaos. While such events are rare, their impact is so high that contingency planning is not optional; it is a core component of a resilient network strategy. Maintaining continuity during such a crisis is not about luck; it is about having a pre-defined and well-rehearsed plan of action.
The foundation of this plan is carrier diversification. Relying on a single carrier for a critical trade lane, even if they offer the best rates, creates an unacceptable level of risk. A resilient strategy involves allocating volume across at least two or three pre-vetted carriers for each major lane. This not only provides an immediate backup but also gives you leverage and operational flexibility. Furthermore, it’s crucial to build deep, collaborative partnerships with your core carriers. A transactional relationship based purely on price will leave you with little support in a crisis. A strategic partner will be more willing to work with you to find solutions.

Beyond diversification, your contingency plan must include tactical adaptation strategies. This means having a playbook that outlines immediate steps: identifying all cargo currently with the affected carrier, communicating proactively with customers about potential delays, and activating your secondary and tertiary carriers. Agility is paramount. The organizations that thrive in challenging conditions are those that can pivot quickly, constantly refining their processes and staying open to new ideas to ensure clients receive the best possible service.
Finally, fostering a performance-driven culture within your own team is essential. When a crisis hits, you need a team that is empowered to make quick decisions, innovate under pressure, and collaborate effectively to solve problems. This culture is not built overnight; it is the result of continuous training, empowerment, and a shared understanding that in logistics, change is the only certainty. A robust contingency plan is your network’s insurance policy against catastrophic failure.
To put these strategies into practice, the next logical step is to benchmark your current network against these Lean principles. Begin by identifying one core process within your operation and schedule your team’s first Gemba walk to uncover its true potential.